News in Oil, Gas and Energy on 24 July 2026: Brent Surpasses $100 per Barrel Amid Mine Warfare in the Strait of Hormuz, EU Approves 21st Sanctions Package with Price Cap Freeze, TTF Gas Up 50%, Overview of Oil, Gas, LNG, Oil Products, Refineries, Electricity, Renewables and Coal Markets for Investors and Energy Sector Participants
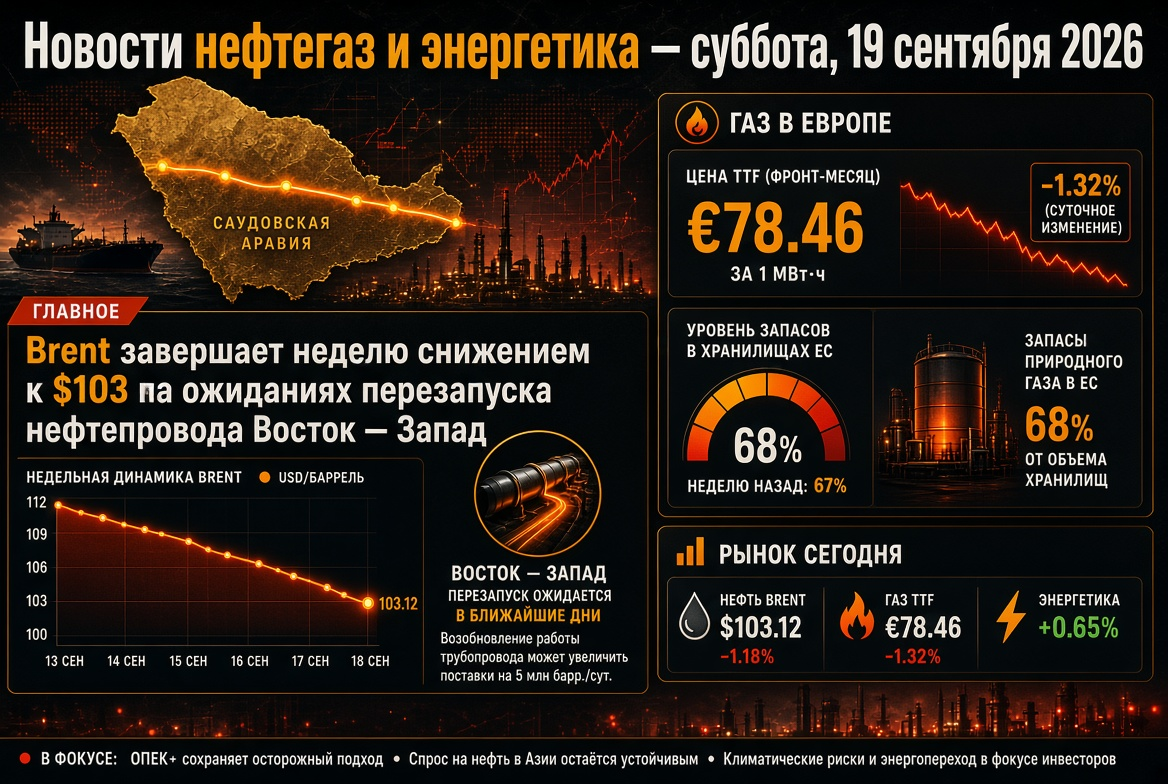
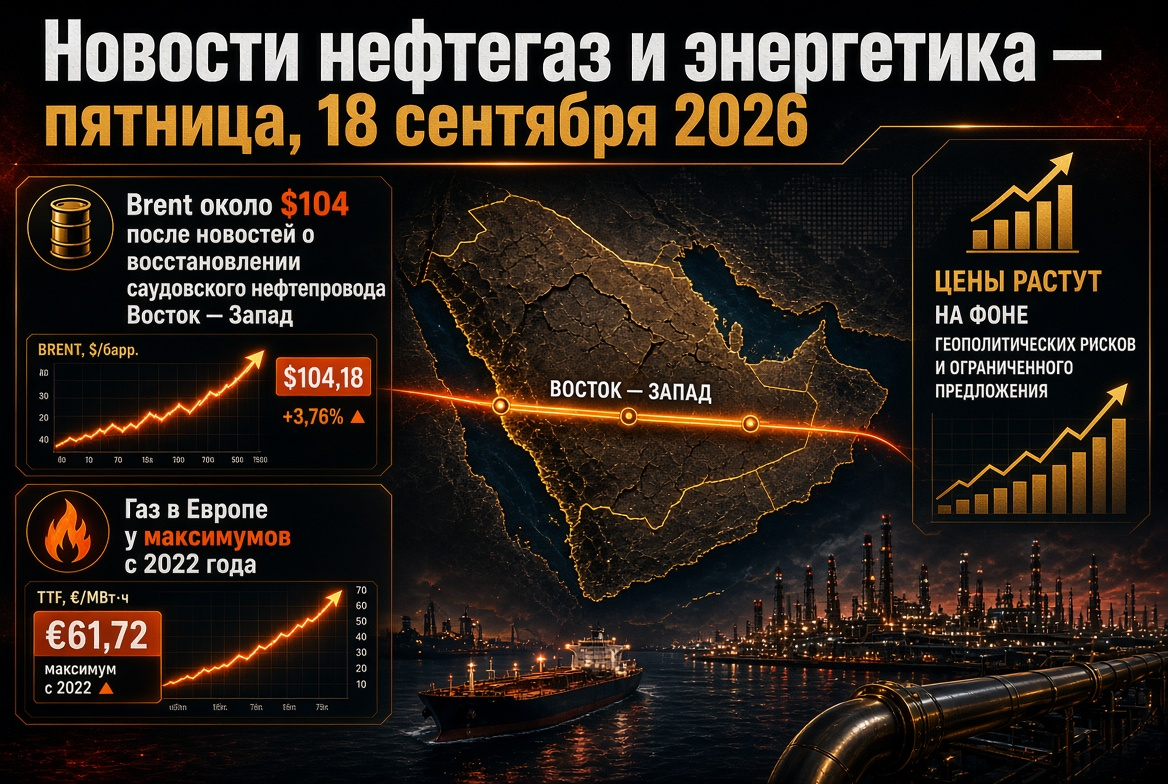
The global energy market has entered its most acute phase since the spring of 2026. On Thursday, 23 July, Brent crude prices surged more than 7%, surpassing $101 per barrel for the first time since 22 May, while American WTI climbed above $92. The catalyst was the explosion of an oil tanker on mines in the southern part of the Strait of Hormuz, along with a statement from the Iranian Revolutionary Guard Corps indicating that this key artery for global oil trade would remain closed. Concurrently, the European Union approved its 21st sanctions package against Russia, with European gas prices at the TTF hub rising by approximately 50% over the past three weeks. For investors, fuel and oil companies, energy market participants, oil product traders, and refinery operators, 24 July marks a day for re-evaluating all fundamental scenarios—from freight costs to electricity generation costs in Europe and Asia.
Oil Market: Geopolitical Premium Returns to Prices
The oil market experienced its sharpest single-day spike in recent months. Trading dynamics on 23 July were consistently upward: in the morning, Brent surpassed $98, then $99 by midday, crossed the $100 mark, and by evening secured itself above $101 per barrel. WTI exceeded the $90 threshold for the first time since 11 June, reaching $92.4.
Key factors driving oil price increases include:
- Physical blockade of the Strait of Hormuz. Prior to the escalation, approximately a quarter of the world's maritime oil trade and around 20% of global LNG supplies passed through this strait. Mining shipping routes transforms insurance risks into real operational losses.
- Escalation of conflict affecting maritime communications. Attacks on tankers are being reported not only in the Persian Gulf but also in the Red Sea, extending logistic routes and increasing freight rates.
- U.S. military reinforcement in the region and a continued series of nighttime strikes on Iranian facilities, including port and missile infrastructure.
- Lack of negotiation tracks. Tehran has signaled its unwillingness to negotiate, removing the prospect of a quick de-escalation from the market.
For energy market participants, it is fundamentally important that the current risk premium is logistically rather than speculatively based: it is not the extraction itself that is under threat, but the ability to export raw materials from the world's largest export hub.
Strait of Hormuz: From Threat to Blockade
The situation in the strait is evolving according to the most severe scenarios discussed. Reports indicate that three oil tankers attempted to cross a mined section in the southern strait, one of which exploded and caught fire. Iranian military officials assert that they control the entry and exit points of the strait, which will remain fully closed as long as American strikes continue.
The U.S. Central Command rejects this interpretation, insisting that the international waterway remains open for transit, and the IRGC is merely attempting to compel vessels to follow the routes it dictates. The divergence in official positions itself becomes a factor of price risk: shipowners and insurers are not guided by political statements but rather by actual incidents.
Implications for the Oil Products and Freight Markets
- Sharp increase in military insurance premiums for tankers heading to the Persian Gulf.
- Extended routes and increased fleet turnover—effectively reducing the effective tanker supply.
- Widening spreads between Middle Eastern and Atlantic crude varieties.
- Pressure on the margins of Asian refineries, which critically depend on Middle Eastern crude.
OPEC+: Cautious Quota Increase Amid Shortages
The alliance's policy appears conservative in light of the price surge. For the month of August, seven OPEC+ countries—Russia, Saudi Arabia, Iraq, Kuwait, Algeria, Kazakhstan, and Oman—have agreed to increase quotas by 188,000 barrels per day, similar to decisions taken in June and July. The total quota for the alliance in August stands at approximately 36.02 million barrels per day. Both Russia and Saudi Arabia's quotas will increase by around 62,000 b/d each.
Significant structural changes within the alliance include:
- The withdrawal of the UAE from the organisation has reduced the number of countries participating in monthly production management.
- Iraq is publicly seeking an upward revision of its quotas.
- Actual OPEC+ production fell to 33.13 million b/d in May, down from 42.77 million b/d in February—the gap between quotas and actual supply remains dramatic.
- Compensatory obligations for overproduction remain in place for Kazakhstan and Oman.
The practical conclusion for investors is that the alliance currently lacks sufficient spare capacity to quickly compensate for the loss of Middle Eastern exports, meaning that the mechanism for price stabilization through quotas operates with limitations.
Gas Market: Europe Risks Not Filling Storage for Winter
The European gas market finds itself in its most vulnerable position in several years. The price of the benchmark TTF futures on 22 July exceeded €62 per MWh—approximately 49% higher than the end of June levels and close to the peaks seen in the early days of the Iranian conflict. In dollar terms, prices rose to around $700 per thousand cubic meters, with the conflict's highest point recorded on 19 March at $853.7 due to a sharp reduction in LNG production from Qatar.
Storage Issues in Underground Gas Facilities
The 2025–2026 heating season concluded for the EU with extremely low stock levels: as of 1 April, underground storage was only 27.66% full—13.4 percentage points lower than the average for the previous five years. Summer filling is occurring more slowly than scheduled:
- As of 19 July, storage was 53.7% full—15.7 percentage points below the five-year average.
- Daily replenishment fell from 308 million cubic meters in June to 270 million cubic meters in July.
- In the previous year, the average replenishment in mid-summer was around a quarter higher—approximately 338 million cubic meters per day.
Competition for LNG Intensifies
The Asian benchmark JKM rose approximately 25% in July—less than the European TTF, allowing Asia to intercept spot cargoes. A notable situation arose in France: the country expects only 13 LNG cargoes in July—the lowest monthly total in over five years—while eight cargoes planned for August have been redirected to other markets. A mitigating factor remains structural adaptation: over the past four years, Europe has reduced its annual gas consumption by roughly 20% and constructed additional regasification terminals.
An additional risk horizon concerns the timeline for phasing out Russian energy supplies: the EU's full cessation of Russian LNG imports is scheduled for 1 January 2027, while pipeline gas is targeted for cessation by 30 September 2027.
Sanctions: EU Approves 21st Package of Restrictions
On 23 July, the European Union officially approved its 21st sanctions package against Russia, which the head of European diplomacy dubbed the largest in four years—covering a total of 218 items. The package addresses energy, financial services, cryptocurrency, and trade.
Key energy and financial elements include:
- Oil price cap. This has been frozen for a year at around $44 per barrel—meaning Russia will not benefit from the current surge in global prices.
- Banking block. The prohibition on transactions with an additional 32 Russian banks; overall restrictions will affect more than a hundred banks and cryptocurrency companies.
- Shadow fleet. Sanctions against more than 40 vessels aiding in transportation. Prior to the package's enactment, the total number of tankers under direct restrictions from the U.S., EU, and UK was 886 from an estimated fleet of 800–1200 vessels.
- Refining. Several refineries in Russia and Belarus have come under restrictions.
- Trading platforms. Platforms trading oil and cryptocurrencies have been added to the list of prohibited transactions.
Importantly, the new package did not directly affect Russian LNG, and oil trading is not entirely blocked. Experts draw attention to a paradoxical effect: a rigid frozen cap can reduce discounts and, in some cases, sustain the price of Russian oil, as the market has already adapted to transport using vessels registered outside the EU.
Russian Oil Products Market: Shortages, Imports and Extension of Export Ban
The domestic fuel market in Russia is currently experiencing one of its most strained seasons. According to Rosstat, production of oil products has fallen by 21.8%—a direct consequence of forced shutdowns and repairs at refineries.
Causes of Tension
- Repair work at oil refineries due to drone attacks.
- High summer demand: holiday season, road tourism and agricultural fieldwork.
- Logistical restrictions in southern regions.
- High export volumes of oil products in previous periods.
Government Regulation Measures
- Export restrictions. The ban on gasoline exports has been in place since April 2026, and since July, restrictions have been extended to a broader range of diesel fuel market participants. A full ban on the export of diesel, marine fuel, jet fuel, and gas oils has been implemented. An extension of the ban until October is under discussion.
- Maximising refinery capacity. Scheduled repairs at Siberian plants have been postponed to autumn 2026, the duration of current repairs has been shortened, and the capacities of medium and small refineries have been activated.
- Exchange regulation. The mandatory exchange sales norm for gasoline has been reduced from 15% to 10%, and the price fluctuation limit has been restricted to a hundredth of the transaction amount.
- Fuel imports. Belarus has redirected gasoline volumes to the Russian market to smooth out local shortages, and discussions are underway regarding supplies from India.
- Regional limits. In several regions, restrictions have been introduced on the sale of fuel in canisters and daily sales limits per individual.
The situation regarding domestic market provision has begun to improve following the introduction of export restrictions; however, the risks of price increases remain. The key variable is the stability of refinery operations: analysts point out that if processing issues are resolved, price reductions may be possible within two to three months.
Electric Power and Renewables: Low-Carbon Generation Outpaces Coal
In the midst of hydrocarbon turbulence, the renewable energy sector is demonstrating a structural shift. For the first time in recorded history, the growth of global electricity consumption—around 3% year-on-year—has been entirely covered by low-carbon sources. Renewable energy, combined with hydro generation, has collectively surpassed coal in the global energy mix, while solar generation has increased by approximately 30%.
The regional picture is uneven:
- China has achieved record results in the commissioning of wind and solar generation, with emissions rising by just 0.3%.
- India has increased its share of renewable energy by nearly 24%, with emissions up by 0.9%.
- Germany achieved a renewable share of 58% in electricity consumption by the end of the first half of 2026.
- Japan is facing challenges in offshore wind energy as major players exit projects.
For investors, the practical effect is significant: with gas priced around €62 per MWh, the economics of solar power plants with storage systems and virtual power plants combining small hydro and lithium-ion batteries become significantly more attractive. An additional demand driver is the rapid growth in energy consumption from data centres, fuelled by artificial intelligence, which has tripled over the past year.
Coal: Stabilising Role Amid the Gas Crisis
Despite losing its leadership in the global energy balance, coal continues to play a balancing resource role. High gas prices in Europe objectively enhance the competitiveness of coal generation during peak demand moments and in windless weather. In the Asia-Pacific region, coal-fired power plants remain the backbone of energy supply: in India, they still account for a significant portion of generation, while China maintains production levels to cover a large share of domestic demand.
For the coal market, the current environment signifies support for demand from European and Asian energy companies aiming to reduce dependence on expensive LNG in the upcoming heating season.
Key Indicators for Investors and Energy Sector Participants
In the coming weeks, the following indicators will be critical:
- Status of shipping in the Strait of Hormuz. The restoration of transit could quickly alleviate the $10–15 risk premium from prices; new incidents with tankers could conversely drive prices above $105.
- Gas injection rates into European storage facilities. Sustained delays of 15+ percentage points from the five-year average by September will render a winter price spike almost unavoidable.
- Competition between the EU and Asia for spot LNG cargoes and the dynamics of the TTF–JKM spread.
- OPEC+ decision on September quotas and the alliance's ability to convert quotas into physical deliveries.
- Implementation practices concerning the 21st EU sanctions package—most importantly regarding the shadow fleet and banking transactions.
- Restoration of capacities at Russian refineries and decisions on the duration of the export ban on gasoline and diesel fuel.
In Summary: The Market Has Shifted to Risk-Based Pricing
On 24 July 2026, the global energy sector operates on a logic where the defining factor for the prices of oil, gas, oil products, and electricity is not the balance of supply and demand but the reliability of transportation corridors. Oil above $100, gas in Europe 50% more expensive than a month ago, the largest sanctions package from the EU in four years, and fuel shortages in the Russian domestic market—all these are different manifestations of a single phenomenon: the fragmentation of global energy logistics.
For oil and fuel companies, this means a need to reassess hedging strategies and freight contracts. For energy companies, it signals an accelerated diversification of generation and investments in energy storage systems. For investors, it represents a period of increased volatility, during which assets that control logistics and processing, rather than merely raw material stocks, will attract premiums.